At our heart, we just want you to be able to do your research better. If you have an idea, or want to see the innovations that we are experimenting on then let’s talk.
Examples of innovator dashboards that we have done for the research world include:
An interactive conjoint analysis tool
A fieldwork dashboard that shows progress across multiple countries and multiple suppliers
A dashboard that alerts you to anomalies in your data
A dashboard that alerts you if someone gives you a bad CSAT score
Research dashboards that work seamlessly on mobile phones.
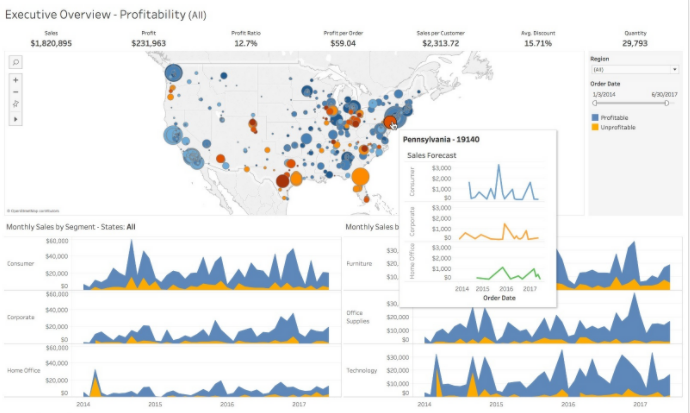
We use Tableau as our tool of choice for developing our dashboards. They are the market leader in Business Intelligence tools
Tableau have an aggressive development cycle. Every quarter they release new features. We keep up with these developments and translate them into meaningful tools for the market research industry.
Connecting to any data
Whether it is SPSS, Excel, Postgres database or something else. We are yet to find a data source that doesn’t work for our dashboards
We typically prepare our data processes using Python, the programming language of choice for data scientists. This allows us to manipulate and enhance data, and test our processes quickly and efficiently.